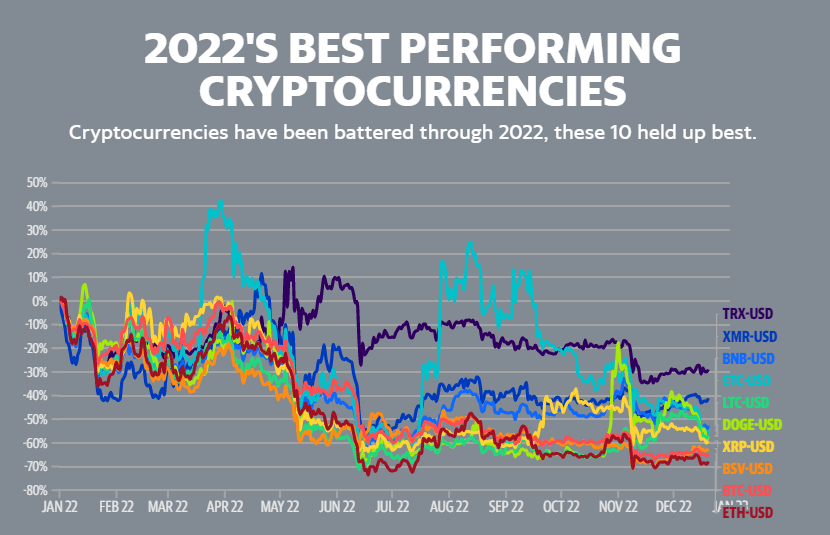
2022 was an unusual year for the stock market
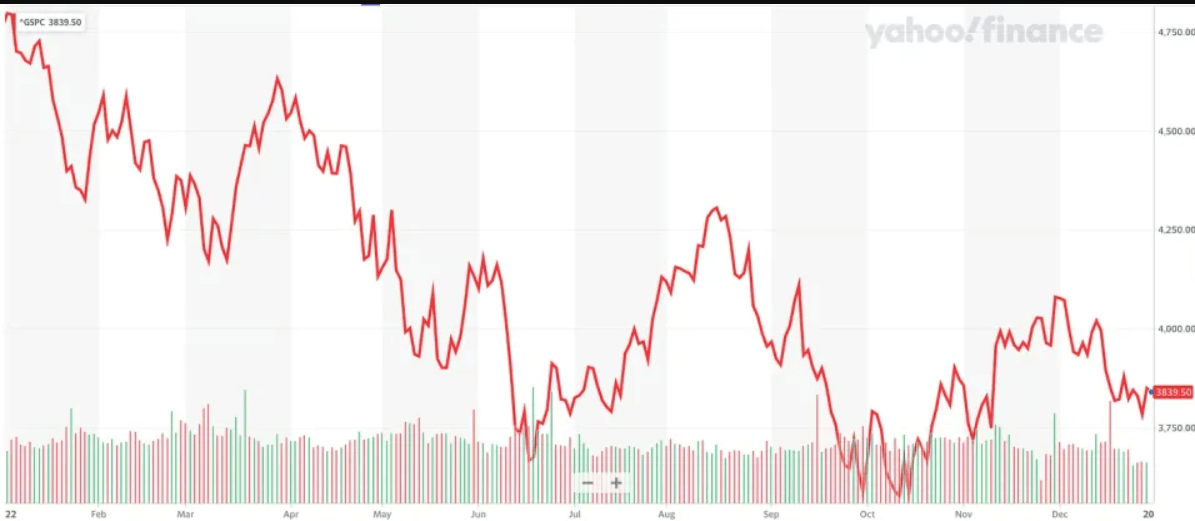
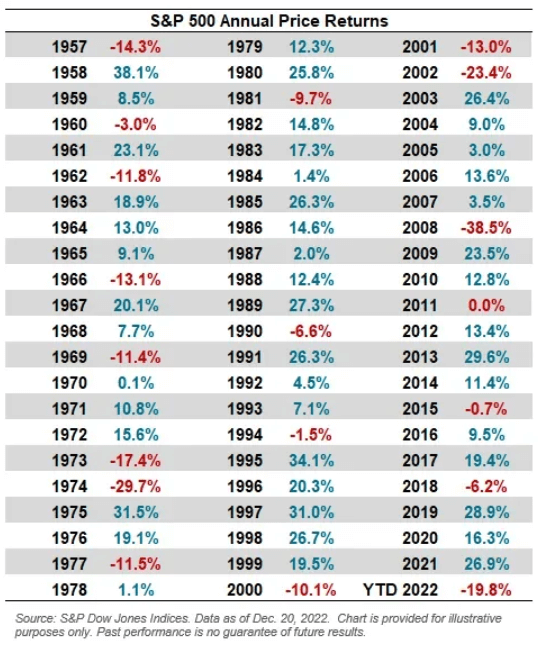
The S&P 500 closed Friday at 3,839.50, down 19.4% for the year. This makes 2022 the worst year for the S&P since 2008 and the fourth-worst year since the index’s launch 1957.
While it may be the case that the stock market usually goes up, 2022 was a reminder it doesn’t always go up. This is just part of the deal when it comes to successful long-term investing. The road to stock market riches comes with lots of ups and downs.
According to data compiled by Carson Group’s Ryan Detrick, the S&P 500 has had a positive year 71% of the time. It’s an incredible track record, but it isn’t perfect.
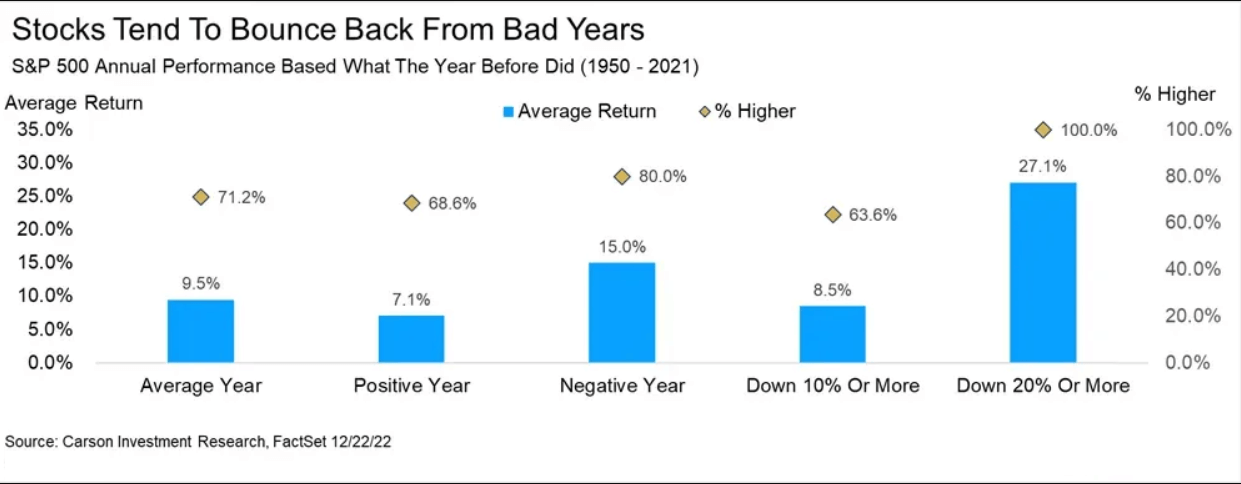
If history is a guide, then the odds favor positive returns in 2023. According to Detrick’s data, the S&P follows a negative year with a positive year 80% of the time with an average gain of 15%.
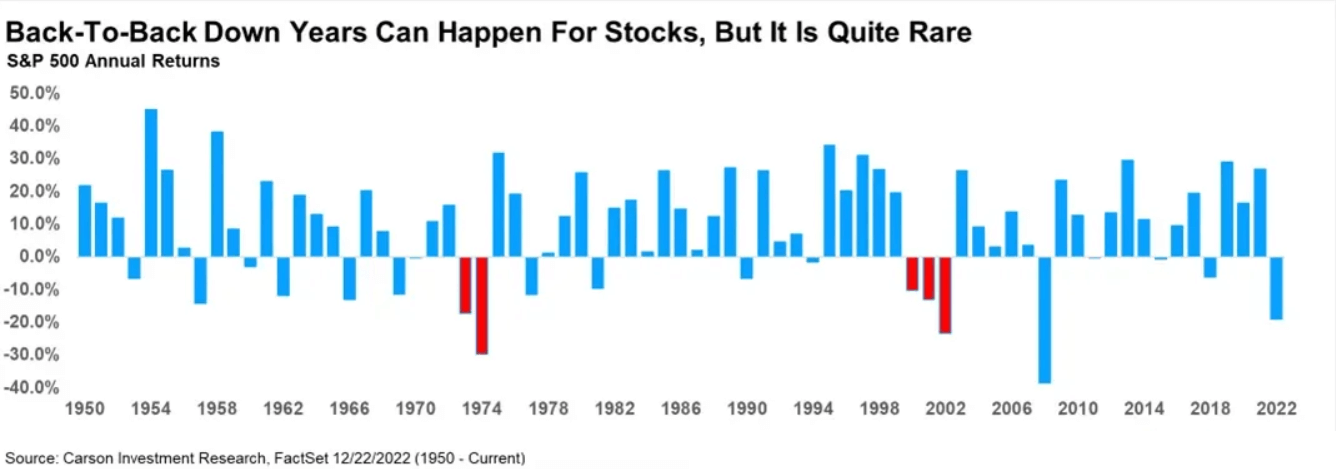
Again, the track record isn’t perfect. While it’s unusual for the S&P to see two consecutive years of negative returns, it’s not unprecedented. It happened after 1973 and 2000, and the subsequent year’s returns actually got worse.
TKer’s best insights about the stock market 📈
- 10 truths about the stock market 📈The stock market can be an intimidating place: It’s real money on the line, there’s an overwhelming amount of information, and people have lost fortunes in it very quickly. But it’s also a place where thoughtful investors have long accumulated a lot of wealth. The primary difference between those two outlooks is related to misconceptions about the stock market that can lead people to make poor investment decisions.
- Stomach-churning stock market sell-offs are normal🎢 Investors should always be mentally prepared for some big sell-offs in the stock market. It’s part of the deal when you invest in an asset class that is sensitive to the constant flow of good and bad news. Since 1950, the S&P 500 has seen an average annual max drawdown (i.e., the biggest intra-year sell-off) of 14%.
- Wall Street’s 2023 outlook for stocks 🔭 I wouldn’t bet everything on a one-year prediction.Keep in mind that recent stock market performance won’t tell you what’ll happen in the coming months. Knowing where earnings are headed next year won’t necessarily tell you where stocks are headed. And while we’re on the subject of prices and earnings, the price/earnings ratio won’t tell you what’s coming next year, either. However, we do know that the stock market usually goes up in most years, and the long game is undefeated. And when you’re investing in stocks, time is a valuable edge.
- How stocks performed when the yield curve inverted ⚠️ There’ve been lots of talk about the “yield curve inversion,” with media outlets playing up that this bond market phenomenon may be signaling a recession. Admittedly, yield curve inversions have a pretty good track record of being followed by recessions, and recessions usually come with significant market sell-offs. But experts also caution against concluding that inverted yield curves are bulletproof leading indicators.
- How the stock market performed around recessions 📉📈 Every recession in history was different. And the range of stock performance around them varied greatly. There are two things worth noting. First, recessions have always been accompanied by a significant drawdown in stock prices. Second, the stock market bottomed and inflected upward long before recessions ended.
- In the stock market, time pays ⏳ Since 1928, the S&P 500 generated a positive total return more than 89% of the time over all five-year periods. Those are pretty good odds. When you extend the timeframe to 20 years, you’ll see that there’s never been a period where the S&P 500 didn’t generate a positive return.
- 700+ reasons why S&P 500 index investing isn’t very ‘passive’💡 Passive investing is a concept usually associated with buying and holding a fund that tracks an index. And no passive investment strategy has attracted as much attention as buying an S&P 500 index fund. However, the S&P 500 — an index of 500 of the largest U.S. companies — is anything but a static set of 500 stocks. From January 1995 through April 2022, 728 tickers have been added to the S&P 500, while 724 have been removed.
- The key driver of stock prices: Earnings💰 For investors, anything you can ever learn about a company matters only if it also tells you something about earnings. That’s because long-term moves in a stock can ultimately be explained by the underlying company’s earnings, expectations for earnings, and uncertainty about those expectations for earnings. Over time, the relationship between stock prices and earnings have a very tight statistical relationship.
When the Fed-sponsored market beatings could end 📈 At some point in the future, we’ll learn a new bull market in stocks has begun. Before we can get there, the Federal Reserve will likely have to take its foot off the neck of financial markets. If history is a guide, then the market should bottom weeks or months before we get that signal from the Fed. - What a strong dollar means for stocks👑 While a strong dollar may be great news for Americans vacationing abroad and U.S. businesses importing goods from overseas, it’s a headwind for multinational U.S.-based corporations doing business in non-U.S. markets.
- Economy ≠ Stock Market 🤷♂️ The stock market sorta reflects the economy. But also, not really. The S&P 500 is more about the manufacture and sale of goods. U.S. GDP is more about providing services.
- Stanley Druckenmiller’s No. 1 piece of advice for novice investors 🧐 …you don’t want to buy them when earnings are great, because what are they doing when their earnings are great? They go out and expand capacity. Three or four years later, there’s overcapacity and they’re losing money. What about when they’re losing money? Well, then they’ve stopped building capacity. So three or four years later, capacity will have shrunk and their profit margins will be way up. So, you always have to sort of imagine the world the way it’s going to be in 18 to 24 months as opposed to now. If you buy it now, you’re buying into every single fad every single moment. Whereas if you envision the future, you’re trying to imagine how that might be reflected differently in security prices.
- Peter Lynch made a remarkably prescient market observation in 1994 🎯 Some event will come out of left field, and the market will go down, or the market will go up. Volatility will occur. Markets will continue to have these ups and downs. … Basic corporate profits have grown about 8% a year historically. So, corporate profits double about every nine years. The stock market ought to double about every nine years… The next 500 points, the next 600 points — I don’t know which way they’ll go… They’ll double again in eight or nine years after that. Because profits go up 8% a year, and stocks will follow. That’s all there is to it.
- Warren Buffett’s ‘fourth law of motion’ 📉 Long ago, Sir Isaac Newton gave us three laws of motion, which were the work of genius. But Sir Isaac’s talents didn’t extend to investing: He lost a bundle in the South Sea Bubble, explaining later, “I can calculate the movement of the stars, but not the madness of men.” If he had not been traumatized by this loss, Sir Isaac might well have gone on to discover the Fourth Law of Motion: For investors as a whole, returns decrease as motion increases.
- ‘Past performance is no guarantee of future results,’ charted 📊 S&P Dow Jones Indices found that funds beat their benchmark in a given year are rarely able to continue outperforming in subsequent years. According to their research, 29% of 791 large-cap equity funds that beat the S&P 500 in 2019. Of those funds, 75% beat the benchmark again in 2020. But only 9.1%, or 21 funds, were able to extend that outperformance streak into 2021.
- One stat shows how hard it is to pick market-beating stocks 🎲 Picking stocks in an attempt to beat market averages is an incredibly challenging and sometimes money-losing effort. In fact, most professional stock pickers aren’t able to do this on a consistent basis. One of the reasons for this is that most stocks don’t deliver above-average returns. According to S&P Dow Jones Indices, only 22% of the stocks in the S&P 500 outperformed the index itself from 2000 to 2020. Over that period, the S&P 500 gained 322%, while the median stock rose by just 63%.
Data via S&P Dow Jones Indices:
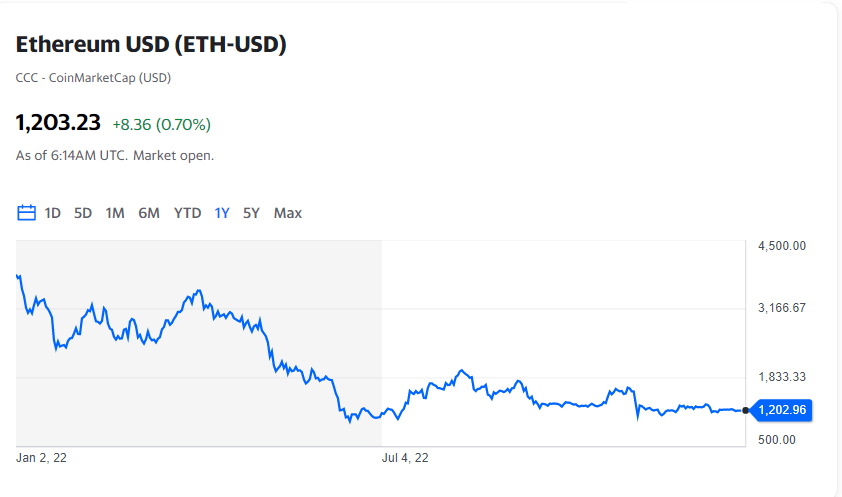
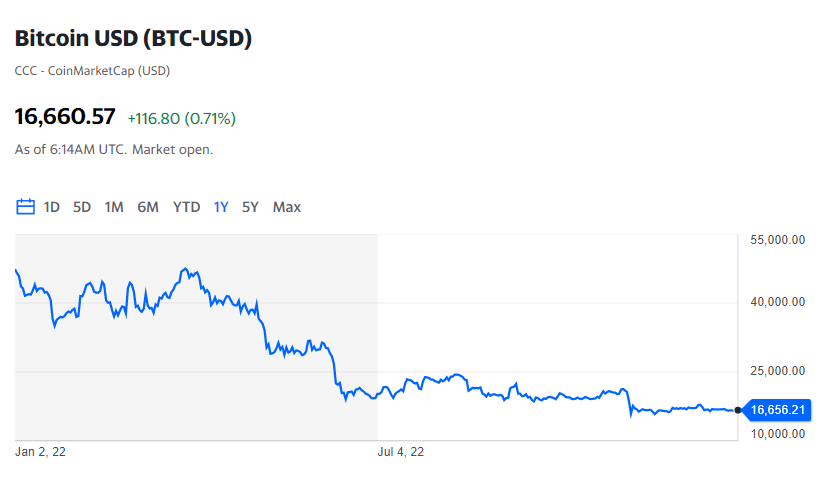
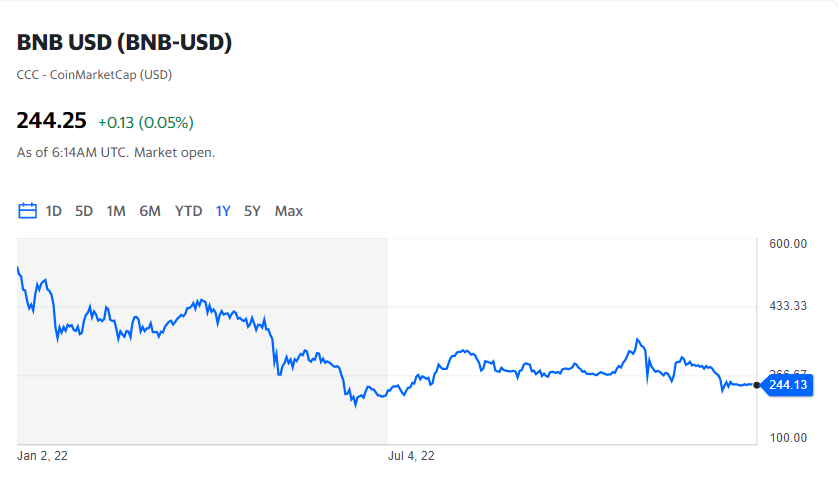
Source: finance.yahoo.com